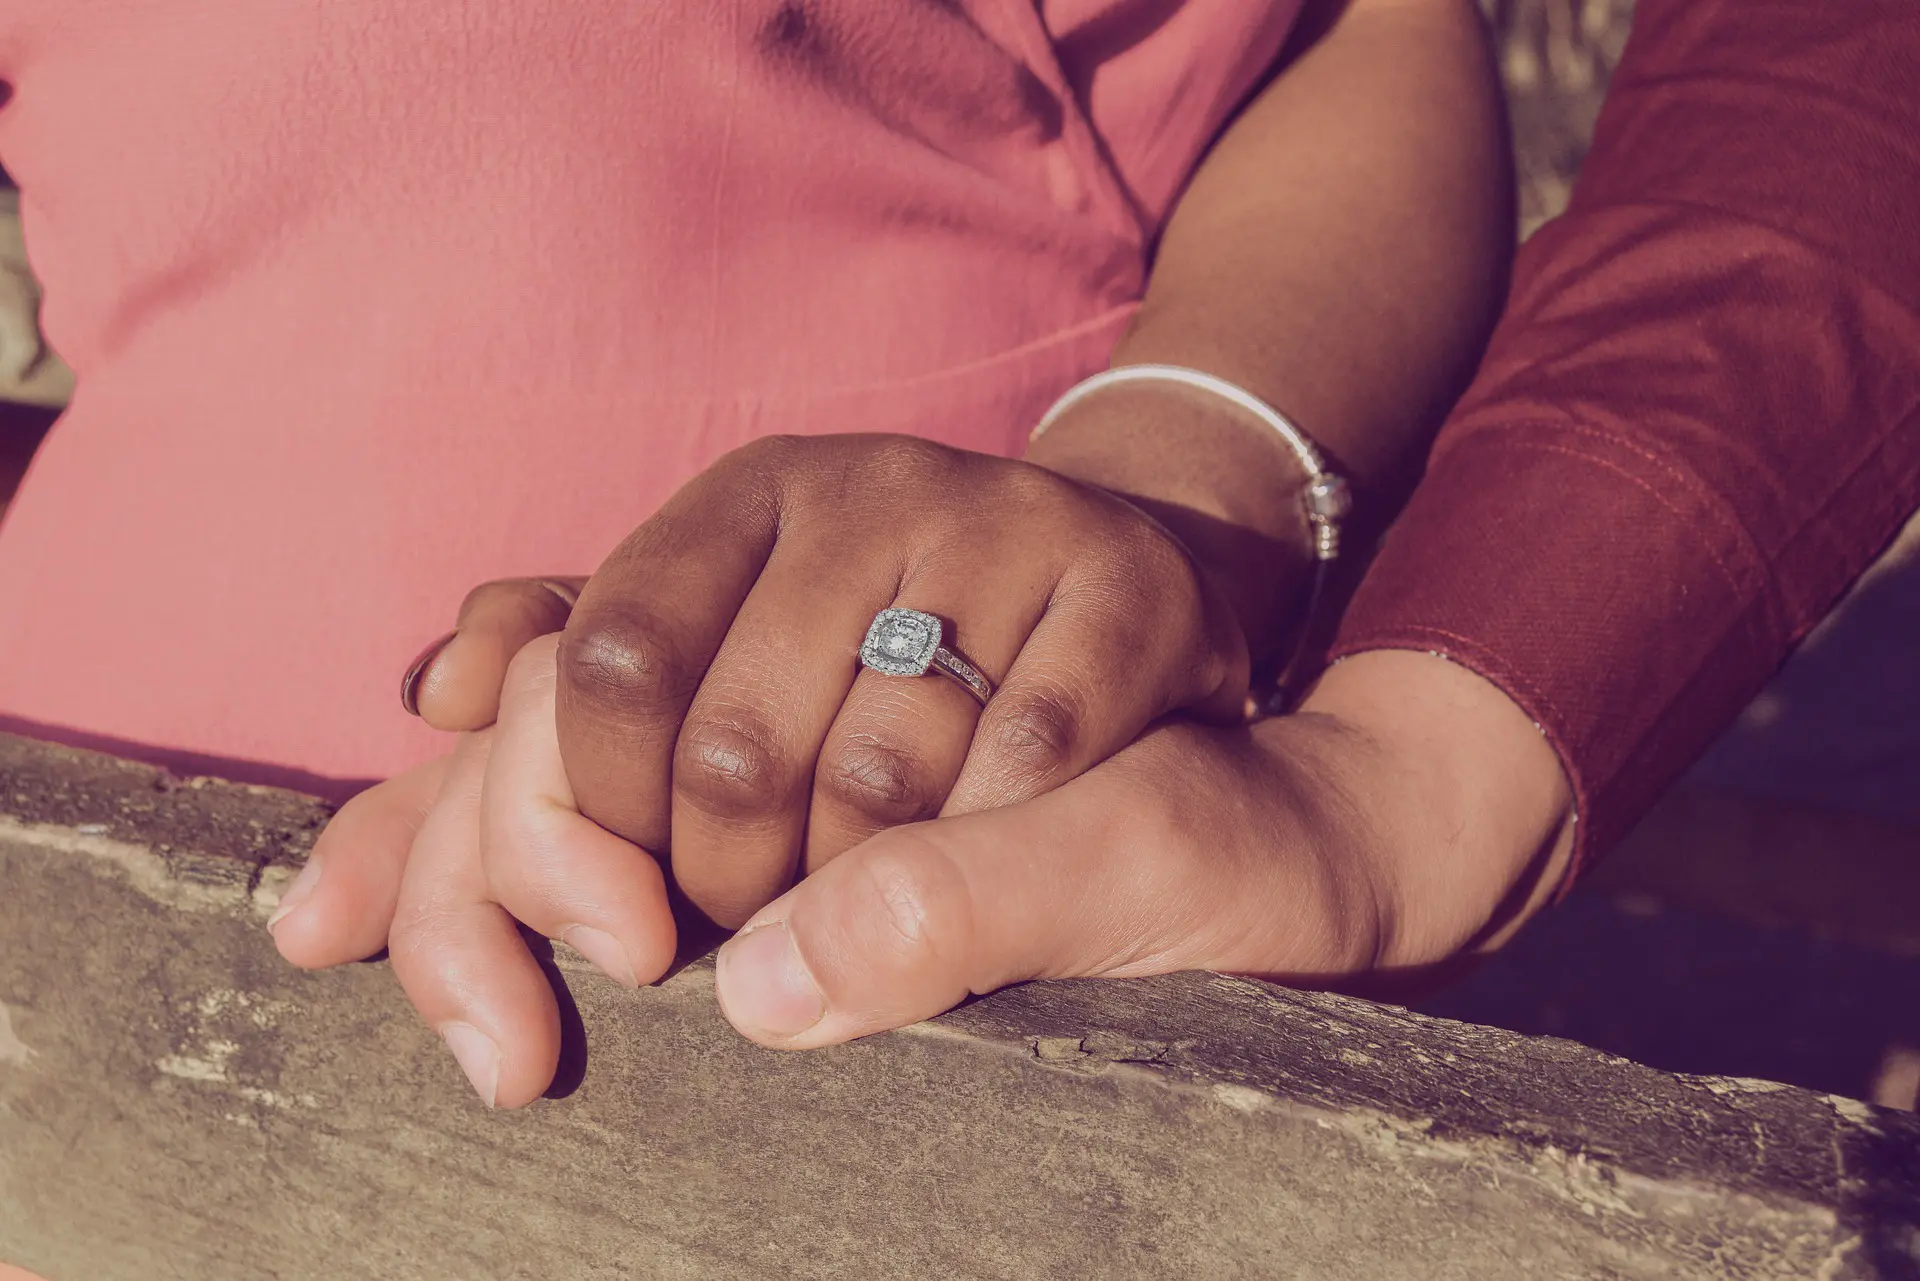
At some point in history, interracial marriages were prohibited by both religious institutions and the states worldwide. These couples have long faced discrimination, ostracizing, even prison, and death because of their love.
Today, in 2022, we are far from these times, although there is more work to be done since interracial couples still encounter prejudice on various accounts all over the world.
We hope that these interracial marriage statistics will answer the questions you may have about the number, length, and social aspects tied to them.
Top 10 Interracial Marriage Statistics for 2024
- Interracial marriage became legal in America in 1967.
- 18% of African-Americans marry someone of a different ethnicity or race, according to the interracial relationship statistics.
- 26% of Hispanic newlywed men have a spouse of a different ethnicity or race.
- Interracial couples statistics reveal that Honolulu, Hawaii, has the highest rate of interracial marriages in America — 42%.
- 20% of African American-Caucasian couples divorce compared with 13.5% of Hispanic-Caucasian couples.
- The US interracial marriage statistics show that 10% of the population (11 million people) are currently in mixed-race unions.
- 22% of Americans believe that multi-racial kids are good for society.
- 42% of the US intermarried couples are between Hispanics and Caucasians, according to the interracial relationship statistics.
- 56% of survey participants aged 18-29 believe that TV shows should feature more interracial couples.
- Interracial marriage statistics and census show that 49% of Democrats believe that interracial marriage is beneficial for society.
Statistics on Interracial Marriage in the United States
You may be surprised to find out that only 55 years ago, the United States of America didn’t allow interracial marriages. In the last half of the century, the numbers and trends have changed drastically. These are just some of the interracial marriage stats in America we found interesting.
1. Interracial marriage became legal in America in 1967.
(PewResearch)
Marriage between two people belonging to different races in America has been fully legal in all states since the Supreme Court in 1967 ruled in the case of Loving v. Virginia.
Many states have chosen to legalize interracial marriage much sooner. In fact, the Loving decision helped banish the interracial marriage prohibition, which was still active in 17 states at the time.
2. The US interracial marriage statistics show that 10% of the population (11 million people) are currently in mixed-race unions.
(PewResearch)
Since the Virginia ruling eliminated the state laws banning interracial marriage, the share of intermarried newlyweds went from 1 in 33 to 1 in 6 in 2015. In fact, in 2015, 17% of newlyweds were married to an individual of a different ethnicity or race.
3. 18% of African-Americans marry someone of a different ethnicity or race, according to the interracial relationship statistics.
(PewSocialTrends)
In comparison, the percentage of Caucasian newlyweds entering interracial marriages increased from 4% to 11%.
4. 49% of Asian newlyweds have a spouse of a different ethnicity or race.
(PewSocialTrends)
Also, around 39% of Hispanics born in America have a spouse of a different ethnicity or race. Nevertheless, the stats are different for Asians and Hispanics who were not born in the US; 29% of Asians and 27% of Hispanics were interracially married in 2015.
5. Interracial marriage statistics by race reveal that 36% of newlywed Asian women have a spouse of a different ethnicity or race.
(PewSocialTrends)
In comparison, 21% of newlywed Asian men intermarry in the United States. When it comes to those of African descent, 24% of African American men are newly intermarried, compared to 12% of African American women.
6. 26% of Hispanic newlywed men have a spouse of a different ethnicity or race.
(PewSocialTrends)
Also, 28% of Hispanic newlywed women entered interracial marriage. When it comes to Caucasians, 12% of recently intermarried are Caucasian men, and 10% are Caucasian women.
7. 39% of Americans believe that marrying someone of a different ethnicity or race is good for society.
(PewSocialTrends)
According to a survey from 2017, the share of adults who claim that interracial marriages are good for Americans has risen by 15% in just seven years.
Also, the percentage of non-African American adults opposing a close relative marrying an individual of African descent today stands at 14%, as opposed to 63% in 1990.
8. The interracial marriage percentage in the US among individuals with a bachelor’s degree or a higher degree is 19%.
(PewSocialTrends)
In comparison, 14% of newlyweds who enter an interracial marriage in the United States have a high school diploma or less. Furthermore, 18% of newlyweds in interracial marriages have some college experience.
9. Statistics on interracial marriage shows that 46% of Hispanic newlywed interracial couples have a bachelor’s degree.
(PewSocialTrends)
The most impressive educational gap can be seen among Hispanics, among which 16% of newlyweds in interracial marriages have a high school diploma or less. When it comes to African American newlyweds, 21% have a bachelor’s degree, and 15% have a high school diploma or less.
10. 42% of the US intermarried couples are between Hispanics and Caucasians, according to the interracial relationship statistics.
(PewSocialTrends)
The findings show that 15% of interracial marriages are between a Caucasian and an Asian spouse, 12% are between a Caucasian and a multiracial spouse, and 11% of interracial marriages include a Caucasian and an African American partner.
18% of newlyweds in metropolitan areas are intermarried, compared to 11% of newlyweds in non-metropolitan areas.
11. Interracial marriage statistics and census show that 49% of Democrats believe that interracial marriage is beneficial for society.
(PewSocialTrends)
However, only 28% of Republicans and those who lean to the Republic Party claim that interracial marriage is a good thing for Americans.
Stats also show that 18% of interracial newlyweds are in their 30s, whereas 13% are 50 years old or older.
12. 56% of survey participants aged 18-29 believe that TV shows should feature more interracial couples.
(Statista)
The survey from 2018 examined the representation of interracial couples in popular American TV shows. 43% of female participants stated that these TV shows need more interracial couples, and in total, 39% of respondents claimed these relationships should be more frequent on TV.
13. Interracial couples statistics reveal that Honolulu, Hawaii, has the highest rate of interracial marriages in America — 42%.
(NCBI) (PewResearch)
Las Vegas, Nevada, comes in second place, with 31% of all marriages being interracial, followed by Santa Barbara, California, with 30%. Nevertheless, the lowest rates of interracial marriages were observed in Birmingham, Alabama, with 6% and Jackson, Mississippi, with only 3%.
Global Interracial Marriage Statistics
Now that we became acquainted with interracial marriages in America, let’s find out more about the support and trends connected to interracial marriages worldwide.
14. Interracial marriage statistics in the UK show that inter-ethnic couples were more likely to cohabit (12%) than married individuals or those in civil partnerships (8%).
(Office for National Statistics)
Also, the most significant difference between married individuals and those cohabiting was witnessed in Asian ethnic groups. In fact, Bangladeshi couples cohabiting were almost seven times more likely to be in an interracial relationship as opposed to Bangladeshis that were in a civil partnership or married.
15. When it comes to interracial marriage statistics, the census shows that 67% of Indians between 18-21 support interracial marriages.
(Statista)
A survey in India analyzing the opinions of young individuals across Kolkata, Delhi, Mumbai, and Kochi found that more than half of the respondents approve of inter-caste and inter-faith dating and marriages. However, 33% were not accepting of interracial marriage in India.
16. Interracial marriage statistics by race reveal that there are 22,698 mixed marriages in South Korea.
(Statista)(StraitsTimes)
These marriage statistics show that there were 16,608 South Korean men and 6,090 South Korean women who had a foreign spouse. According to data, South Korea is home to around 1.7 million foreigners and 795,000 multicultural family members.
17. Over 63% of interracial marriages in South Korea involve foreign-born women, usually from South-east Asian countries.
(StraitsTimes)
Also, more than half of interracial marriages in the country are between local men and women from Japan or China. On the other hand, 24% of South Korean women are married to foreign men.
18. According to interracial marriage articles, the percentage of interracial marriages in Norway is just below 25%.
(ResearchGate)
Also, the percentage in northern Europe, in countries such as Iceland, Sweden and Denmark vary between 11% and 16%. Furthermore, Finland has shown a staggering increase in interracial marriages compared to the rates in the country two decades ago.
Interracial Marriage Divorce Statistics
Divorce statistics all over the world are revealing not so positive numbers due to the strain last year placed on our lives. Let’s take a closer look into these stats to see what the 2022 divorce stats may look like for interracial couples.
19. 41% of interracial couples divorce by the 10th year of marriage, according to the interracial marriage divorce statistics.
(Jstor)
Furthermore, 31% of same-race married couples divorce after ten years of marital life. Some of the most common challenges many interracial couples may need to face include differences in cultures and traditions, although domestic abuse is also prominent on the list of reasons.
20. 20% of African American-Caucasian couples divorce compared with 13.5% of Hispanic-Caucasian couples.
(NCBI)
Furthermore, the researchers found that 8.4% of Asian-Caucasian married couples are likely to divorce or separate. The results hint that interracial couples, especially those with an African American or Hispanic partner, are significantly more likely to divorce compared to couples belonging to the same race.
Children in Interracial Marriage — Statistics
With interracial marriages come multi-racial/multi-ethnic children (unless the couple agreed not to have children). These children are often believed to be much more culturally aware and open-minded since they are exposed to different cultures and customs their whole life. Here’s a bit more about them.
21. Based on the types of interracial couples statistics, 42% of multiethnic or multiracial kids are born from a Hispanic-Caucasian marriage.
(PewResearch)
Data shows that kids from one Caucasian and one Asian parent make up 14%, whereas babies born from one Caucasian and one African American parent make up 10%. The analysis conducted by Pew Research found that the number of multiethnic or multiracial kids make up 14% of babies born in 2015.
22. Interracial marriage statistics by state show that 44% of babies born in Hawaii in 2015 were multiethnic or multiracial.
(PewResearch)
However, only 4% of children under the age of one in Vermont in 2015 were multiethnic or multiracial. According to researchers, the country’s increase in ethnic and racial ethnicity is the reason why mixed babies are a “trend.”
23. 22% of Americans believe that multi-racial kids are good for society.
(HuffPost)
However, interracial marriage articles also show that around 11% claim that multiethnic or multiracial babies are harmful to American society. Nevertheless, the majority of citizens in the United States believe that it does not make a drastic difference.
24. Rate of the multiracial kid and adolescent population in America has increased by 32%.
(APA)
Furthermore, the facts show that children who are multiracial are currently the biggest demographic group among United States citizens who are younger than 18. Experts believe that the huge growth can be explained by the high number of interracial marriages and families.
FAQ
How many mixed race couples are there in the UK?
(BBC)
Even though interracial relationships may seem like a common thing in the United Kingdom, statistics show that they comprise 7% of all relationships in the country.
When it comes to individuals living in the United Kingdom who consider themselves as “mixed,” the figures show 1.2% of the total population in the country. In numbers, this translates to around 677,177 individuals.
What percentage of the population is biracial?
(Census.gov)
According to the 2017 US census, around 5.6% of the total population in the United States identifies as multiracial. The most common multiracial groups in America include Hispanic Americans, African Americans, Métis Americans, and Louisiana Creoles.
There are around 2.4 million multiracial Americans living in the Western United States, and 1.8 million in the Southern United States.
Can online dating sites help in interracial dating?
(Maxim)
92% of users on Tinder believe that online dating makes it easier to meet and date people of different races or ethnicities. The study surveyed more than 4,000 respondents and found that 65% of singles are open-minded about dating someone outside their ethnicity or race.
Conclusion
It is hard to keep marriages healthy and loving with all the challenges couples face in life. Interracial marriages are no different. Race, ethnicity and cultural backgrounds are not an obstacle when people love each other and put the effort in keeping their relationship alive.
Society has come a long way from ostracizing interracial couples — today, we even have dating apps for trans people or those that promote dating among the gay population. This ain’t much, but it is a basis we need to build on.
We presented you with these interracial marriage statistics to try and paint a picture of how increasingly common and accepted they are becoming worldwide. And this is a great thing. We hope these stats answered some questions for you and gave you the information you can use to spread awareness to those who might be against it.


